
If you are developing a project in Laravel you are probably (should?) be using phpunit to execute tests. This tutorial will guide you through setting up a graphical representation of your test coverage so that you can see which lines of your logic are not being tested.
Scenario
In this scenario we shall create a new Laravel project and demonstrate how to install php-code-coverage. We will then use phpunit to create the coverage report.
Before we go any further, you must ensure that you have Xdebug installed for PHP. You can check this easily by issuing the following command in a terminal.
simon@viking:~/PHPProjects$ php -v
 PHP 7.3.8-1 (cli) (built: Aug  7 2019 09:50:45) ( NTS )
 Copyright (c) 1997-2018 The PHP Group
 Zend Engine v3.3.8, Copyright (c) 1998-2018 Zend Technologies
     with Zend OPcache v7.3.8-1, Copyright (c) 1999-2018, by Zend Technologies
     with Xdebug v2.7.2, Copyright (c) 2002-2019, by Derick Rethans
Xdebug will be available in your package manager if you are running a Linux distribution.
Likewise, install composer.phar if you have not already done so.
Installation and Configuration
Firstly create the project, which we shall call ‘blog’ and change to the newly created directory.
simon@viking:~/PHPProjects$ composer create-project --prefer-dist laravel/laravel blog

simon@viking:~/PHPProjects$ cd blog
Using composer, require php-code-coverage for you project. As it is only needed in development or testing environments you can use the --dev flag.
simon@viking:~/PHPProjects/blog$ composer require --dev phpunit/php-code-coverage
Now open phpunit.xml in your favourite editor and add the following logging tag as a child of the root phpunit tag as below. It can be inserted anywhere, but be careful to have it as a child of the root and not inserted in any other tag.
<phpunit  ...>
   ....
   <logging>
      <log type="coverage-html" target="tests/coverage" showUncoveredFiles="true" />
   </logging>
    ....
</phpunit>
Now we execute our tests as follows
simon@viking:~/PHPProjects/blog$ vendor/bin/phpunit
 PHPUnit 8.3.5 by Sebastian Bergmann and contributors.
 ..                                                                  2 / 2 (100%)
 Time: 401 ms, Memory: 24.00 MB
 OK (2 tests, 2 assertions)
 Generating code coverage report in HTML format … done [210 ms]
And as shown on the last line of results, the coverage report has been generate. Open the file in your browser which you will find, in this example, at ~/PHPProjects/blog/tests/coverage/index.html.
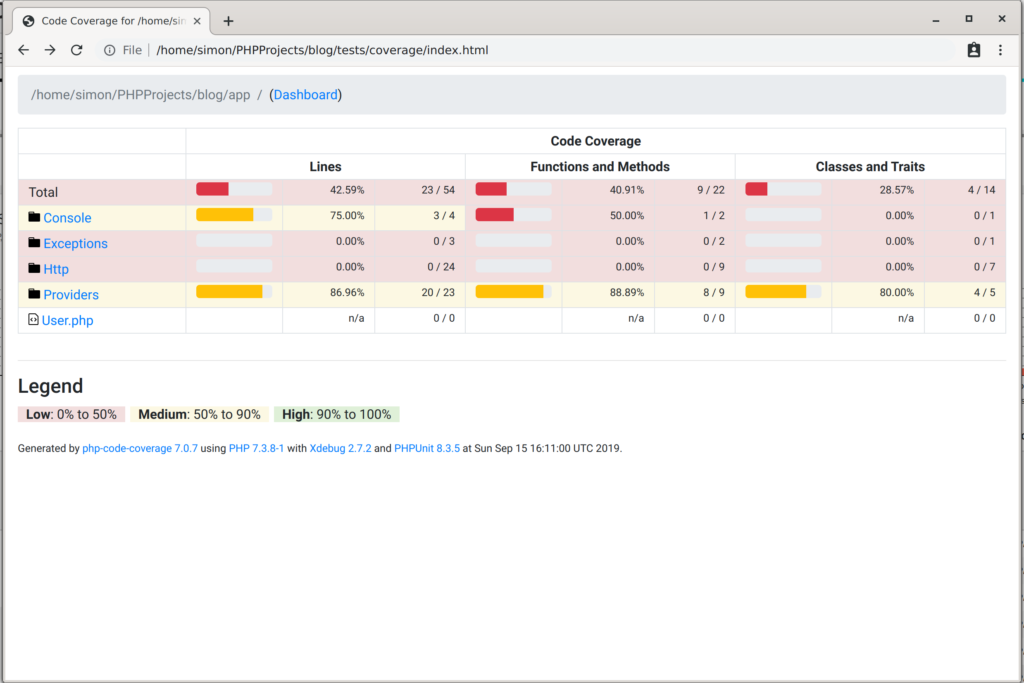
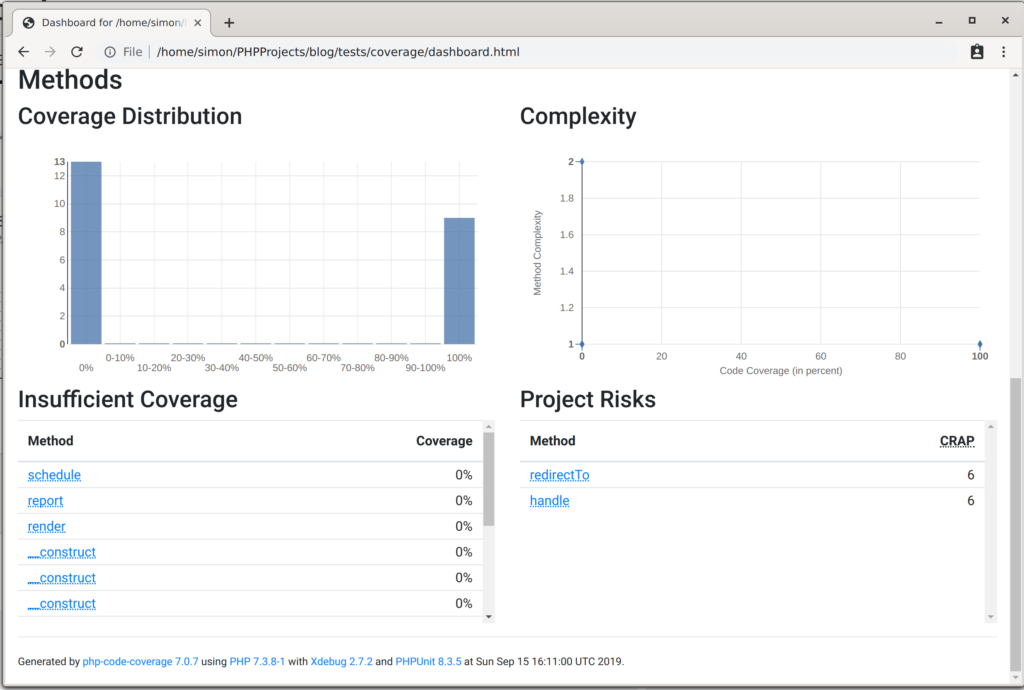
You can now drill through to any file and see which lines of code are covered by test (in this example, not many yet) and view the dashboard which gives you an indication of risks and methods which most need coverage.
Next Steps
In the next part of this tutorial we will cover testing a class and dealing with some of the gotcha’s which phpunit can throw at you.